Political behaviour in Pakistan: PIPS survey challenges conventional wisdom
This survey conducted by the Pak Institute for Peace Studies (PIPS) targeted two groups: registered political party workers and voters. The objective of this exercise was to identify some of the key determinants of political behaviour in Pakistan. It also explored the nature of party affiliation, levels of grassroots participation in political parties’ internal affairs and the rationale of political activism. In the case of voters, the survey made an attempt to gauge the factors that do—or do not—influence their decisions.
The two questionnaires drafted for this survey were limited in scope but concise. The sample size was restrictive as far as political activists were concerned. However, it was doubled in number for the voters’ survey.
The survey covers all provinces of Pakistan as well as the federal capital area of Islamabad, which is clubbed here with its twin city of Rawalpindi. Nonetheless, a majority of respondents belonged to the province of Punjab, which corresponds to its overall population ratio vis-à-vis the rest of the country.
Some of the results of this survey go against the conventional wisdom of Pakistani electoral politics. That grassroots political activism is on the wane is not backed by the findings of this report. Our findings also disprove the widespread notion that whoever is able to transport voters from their homes to the polling booth has an edge over other candidates.
We hope this study would contribute to enhancing our understanding of the behaviour of Pakistani political party workers, in particular, and of voters, in general.
Form No 1: Political Party Workers
Total interviews: 934
Sample Criterion: Registered Political Party Workers
Surveyed Cities:
- Islamabad/Rawalpindi
- Lahore, Gujranwala, Dera Ghazi Khan
- Peshawar, Abbotabad
- Karachi
- Quetta
Analysis of Results
Table 1
When asked to explain the reason of joining the political party they work for, more then 44 per cent respondents said they were impressed by the manifesto and policies of their party. This shows that more grassroots political activists are interested in what the party has to offer in terms of policies and programmes than those who get engaged in politics because of a leader’s charisma or personal charm (38.54 per cent).
Another surprising response to this question is the low level of importance that political workers attach to ethnic or religious identity. Less than five per cent of interviewees chose this marker of identity as the reason why they became member of their respective parties. This trend corresponds to the low degree of family or friends’ advice (0.96 per cent), which implies that active political workers usually make party choices independent of ethnic, religious or family pressures.
|
Why did you join your present political party? |
||
|
Response Categories |
Total Responses |
Percentage |
| 1. Manifesto/Party Programme |
413 |
44.22 |
| 2. Charismatic Leadership |
360 |
38.54 |
| 3. Personal Relations with Party Leadership |
89 |
9.53 |
| 4. Ethnic or Religious Affiliation |
46 |
4.93 |
| 5. Advice of Friend/Family |
9 |
0.96 |
| 6. Any others |
12 |
1.28 |
| 7. No answer |
5 |
0.54 |
 Table 2
Most political party activists (57.92 per cent) do not contribute to party fund. Only 336 of the 934 respondents said they paid their monthly or annual membership fee. That implies that political parties in Pakistan do not rely on membership fee for their finances and that political workers contribute to party activities by campaigning for candidates, extending help in organising meetings and rallies and canvassing, rather than making financial contributions. What may explain this trend is that a majority of workers usually come from low-income groups and while they are willing to invest time and energy in party work, they cannot provide financial support.
|
Do you pay a monthly or annual fee/fund to your party? |
||
|
Response Categories |
Total Responses |
Percentage |
|
Yes |
336 |
35.97 |
|
No |
541 |
57.92 |
|
No answer |
57 |
6.1 |
 Table 3
The response of interviewees to this question highlights the gap between decision-makers in a political party and their grassroots workers. Just over a quarter of the respondents feel they could influence party policies in some way or are given importance by their party. Well over half of them believe they have no influence in their political party and are not important to party organisation. Clearly, ordinary political party workers lack a sense of participation and wield little influence in a party’s decision-making processes.
|
Do you feel you have any influence on your party’s policies? |
||
|
Response Categories |
Total Response |
Percentage |
|
Yes |
256 |
27.38 |
|
No |
497 |
53.16 |
|
No answer |
182 |
19.47 |
 Table 4
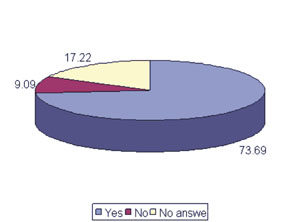
About three-fourths of the interviewees had become workers of their current political party when it was either in power at some tier of governance or was part of a ruling coalition in their province or at the centre. Only 85 respondents (9.09 per cent) said they had joined the party when it was not in power. This trend reflects the overall political culture of Pakistan in which a party’s ability to provide patronage and distribute resources means it can draw more activists from the grassroots to do its organisational and campaign work.
|
When you joined your political party was it in power or part |
||
|
Response Categories |
Total Response |
Percentage |
|
Yes |
689 |
73.69 |
|
No |
85 |
9.09 |
|
No answer |
161 |
17.22 |
 Table 5
There were 175 interviewees who were members of another political party before joining their present party. When asked to explain the reason for their decision to cancel their membership, they came up with a variety of responses. Though personal engagements (32.57 per cent) was the main reason cited by these activists for membership cancellation, many others simply lost trust either in their party or in the political process itself. Most people, however, did not give any particular reason for abandoning their parties.
|
If you were a worker of another party before joining your present
party, what forced you to cancel your previous party’s membership? |
||
|
Response Categories |
Total Response |
Percentage |
|
1. Personal engagements |
57 |
32.57 |
|
2. Did not trust your party any more |
33 |
18.86 |
|
3. Did not trust political process any more |
7 |
4 |
|
4. Any other |
2 |
1.14 |
|
5. No answer |
76 |
43.43 |
 FORM 2
Sample Criterion: Registered Voters
Total Respondents: 1893
Surveyed Cities
1. Islamabad/Rawalpindi
2. Lahore, Gujranwala, Dera Ghazi Khan
3. Karachi
4. Quetta
Table 1
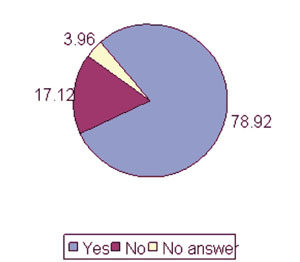
A large number of voters interviewed for this survey are already supporters of one or the other political party. Nearly 79 per cent of them replied in the affirmative when asked if they were supporters of a particular political party, whereas just over 17 per cent did not prefer any one party.
|
Have you ever been a supporter of a particular political party? |
||
|
Response Categories |
Total Response |
Percentage |
|
Yes |
1494 |
78.92 |
|
No |
324 |
17.12 |
|
No answer |
75 |
3.96 |
 Table 2
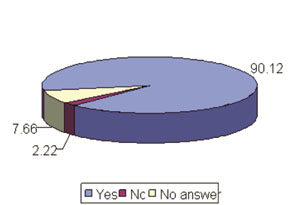
The result shown in this table underscores the personality factor in Pakistani elections as more than 90 per cent respondents said that a candidate’s personal ability and personality was a major consideration for them.
|
Is the personal ability or personality of a candidate a |
||
|
Response Categories |
Total Response |
Percentage |
|
Yes |
1706 |
90.12 |
|
No |
42 |
2.22 |
|
No answer |
145 |
7.66 |
 Table 3
One of the common perceptions about elections in Pakistan is that the candidate who can provide conveyance to a maximum number of voters is assured of winning the vote. As the following tables show that is just a myth. Whereas a large section of voters (78.71 per cent) interviewed for this survey admitted to using the conveyance facility provided by candidates, more than 75 per cent said it did not affect their voting choice. So, while it ensures that voters who have no personal means of transport get to polling stations, a candidate’s investment in transport does not necessarily translate into votes.
|
Do you use the conveyance facility provided by |
||
|
Response Categories |
Total Response |
Percentage |
|
Yes |
488 |
78.71 |
|
No |
132 |
21.29 |

|
Does this facility affect your voting choice? |
||
|
Response Categories |
Total Response |
Percentage |
|
Yes |
61 |
3.22 |
|
No |
1430 |
75.54 |
|
No answer |
402 |
21.24 |


